Most Phase II CNS trials allocate a handful of lumbar puncture timepoints and call it pharmacodynamic monitoring. The clinical pharmacology team knows the resolution is inadequate. The biomarker scientists know the variability is a problem. And yet the field has moved slowly away from CSF-centric PK/PD design — not because better tools didn’t exist, but because no one had a coherent framework for deploying them. Blood-based CNS PK/PD monitoring is no longer aspirational. This article explains how to use it, and when.
Key Takeaways
- Lumbar puncture limits serial PK/PD sampling to 2–3 timepoints per patient, compressing curve resolution and amplifying dropout rates.
- Plasma biomarkers like NfL and GFAP report injury and neuroinflammation — not target engagement. They are not substitutes for mechanistic CNS PD readouts.
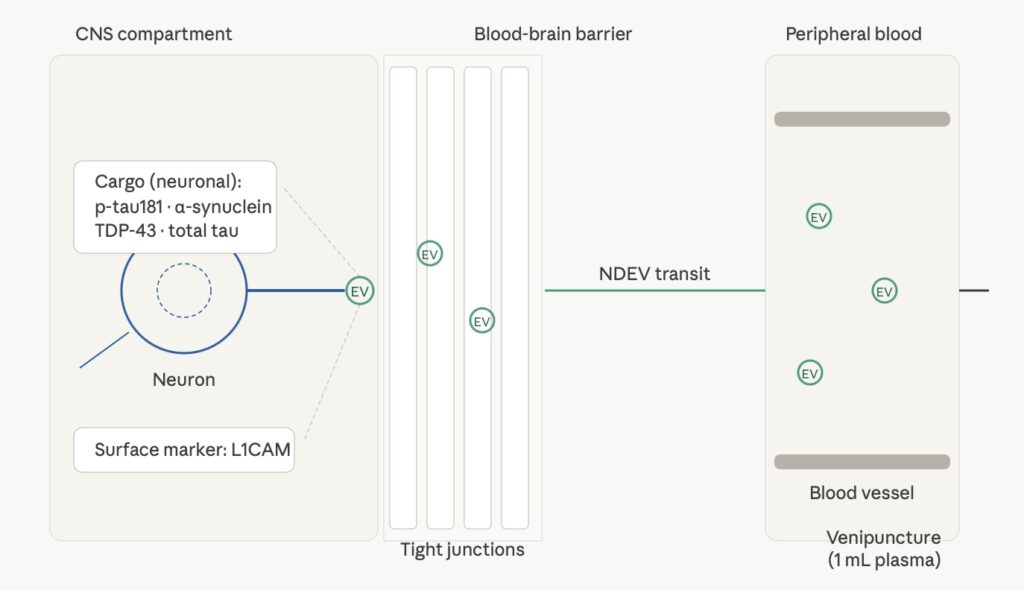
- Neuron-derived extracellular vesicles (NDEVs) carry CNS-specific cargo — p-tau181, α-synuclein, TDP-43 — directly from neurons into peripheral blood, enabling compartment-specific PD monitoring from a blood draw.
- Fit-for-purpose validation, not full biomarker qualification, is the operative standard for exploratory CNS PK/PD biomarkers in Phase I and II.
- A tiered framework maps biomarker modality to trial phase, endpoint class, and regulatory expectation — the decision logic is straightforward once laid out.
The CSF Dependency Is a Structural Problem
Lumbar puncture (LP) remains the dominant method for accessing CNS-compartment biomarkers in clinical trials. The rationale is defensible: CSF bathes the brain and spinal cord, and its protein composition reflects CNS biology more directly than peripheral blood. But LP as a serial sampling strategy has a hard ceiling, and the field has largely accepted constraints that don’t need to be permanent.
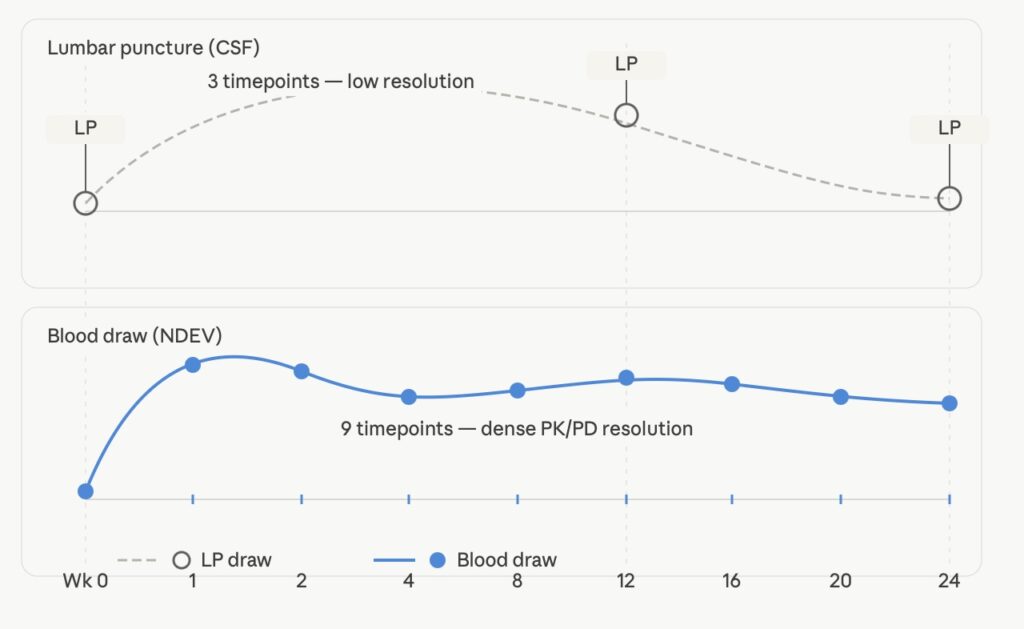
Most trial protocols allow 2–3 LP timepoints per patient across the study duration [1]. That means a 24-week Phase II trial in Alzheimer’s disease might have baseline, week 12, and week 24 CSF draws — enough to fit a three-point PK/PD curve, not enough to characterize drug exposure-response relationships with any kinetic precision. In early-phase oncology, by contrast, serial blood PK sampling across the first dosing interval is standard. The asymmetry is not scientifically justified; it is a legacy of what the CNS field had available.
The procedural burden matters too. Post-LP headache occurs in 10–30% of patients depending on needle gauge and technique [2], and headache, pain, and anxiety are consistently the top-cited reasons for protocol dropout in CNS trials that include LP. Patient burden is not a soft endpoint. It is a trial completion rate, a recruitment timeline, and a statistical power calculation.
Diurnal variation in CSF biomarker concentrations adds another layer of noise. CSF Aβ42 concentrations, for example, fluctuate by up to 20% across the day in young healthy adults, with a circadian rhythm driven by sleep-wake cycles and amyloid clearance dynamics [3]. Timed LP collection addresses part of this, but introduces scheduling constraints that limit flexibility in multi-site trial design.
The point is not that CSF is a bad matrix. It is that CSF-only PK/PD design creates an unnecessary bottleneck in trial execution and limits what teams can actually learn about drug behavior in the CNS.
LP vs. blood sampling timeline:
What Plasma Biomarkers Actually Report
Before building a blood-based CNS PK/PD strategy, teams need to be precise about what different plasma biomarkers can and cannot measure. The field has conflated several distinct biological signals under the umbrella of “blood-based CNS biomarkers,” and that conflation has caused real failures in trial design.
Neurofilament light chain (NfL) is the most widely used blood-based neurodegeneration biomarker. Plasma NfL reflects axonal injury — neurons releasing structural protein into the extracellular space as they degrade. It is elevated in ALS, multiple sclerosis, Alzheimer’s disease, Parkinson’s disease, FTD, and traumatic brain injury [4]. It is sensitive to neuronal damage. It is not CNS-specific. NfL is expressed in peripheral nervous system neurons as well as CNS neurons, and plasma NfL concentrations are confounded by peripheral neuropathy, physical exercise, kidney function, and body mass index [5]. Using plasma NfL as a CNS-specific PD readout in a trial where the drug targets central neurons assumes a CNS specificity that the biomarker does not have.
GFAP (glial fibrillary acidic protein) reports astrocyte activation and astrogliosis. It is a sensitive marker of neuroinflammation and has shown utility as a prognostic marker in Alzheimer’s disease and traumatic brain injury [6]. It does not report neuronal target engagement with a CNS drug. A GFAP response tells you about glial biology — useful context, not a PD readout for a compound targeting tau aggregation or α-synuclein pathology.
Total tau and p-tau181 measured directly from plasma are emerging as more mechanistically informative. Plasma p-tau181 concentrations correlate with Aβ-PET status and predict longitudinal cognitive decline in Alzheimer’s disease [7]. But plasma p-tau181 is present at concentrations roughly 100-fold lower than in CSF, and the total tau pool in plasma includes protein shed from non-neuronal sources. Sensitivity and CNS specificity are the persistent limitations of direct plasma protein measurement.
The practical implication: plasma injury and inflammation markers (NfL, GFAP) can anchor a safety and disease-progression monitoring strategy. They cannot anchor a CNS-specific pharmacodynamic claim.
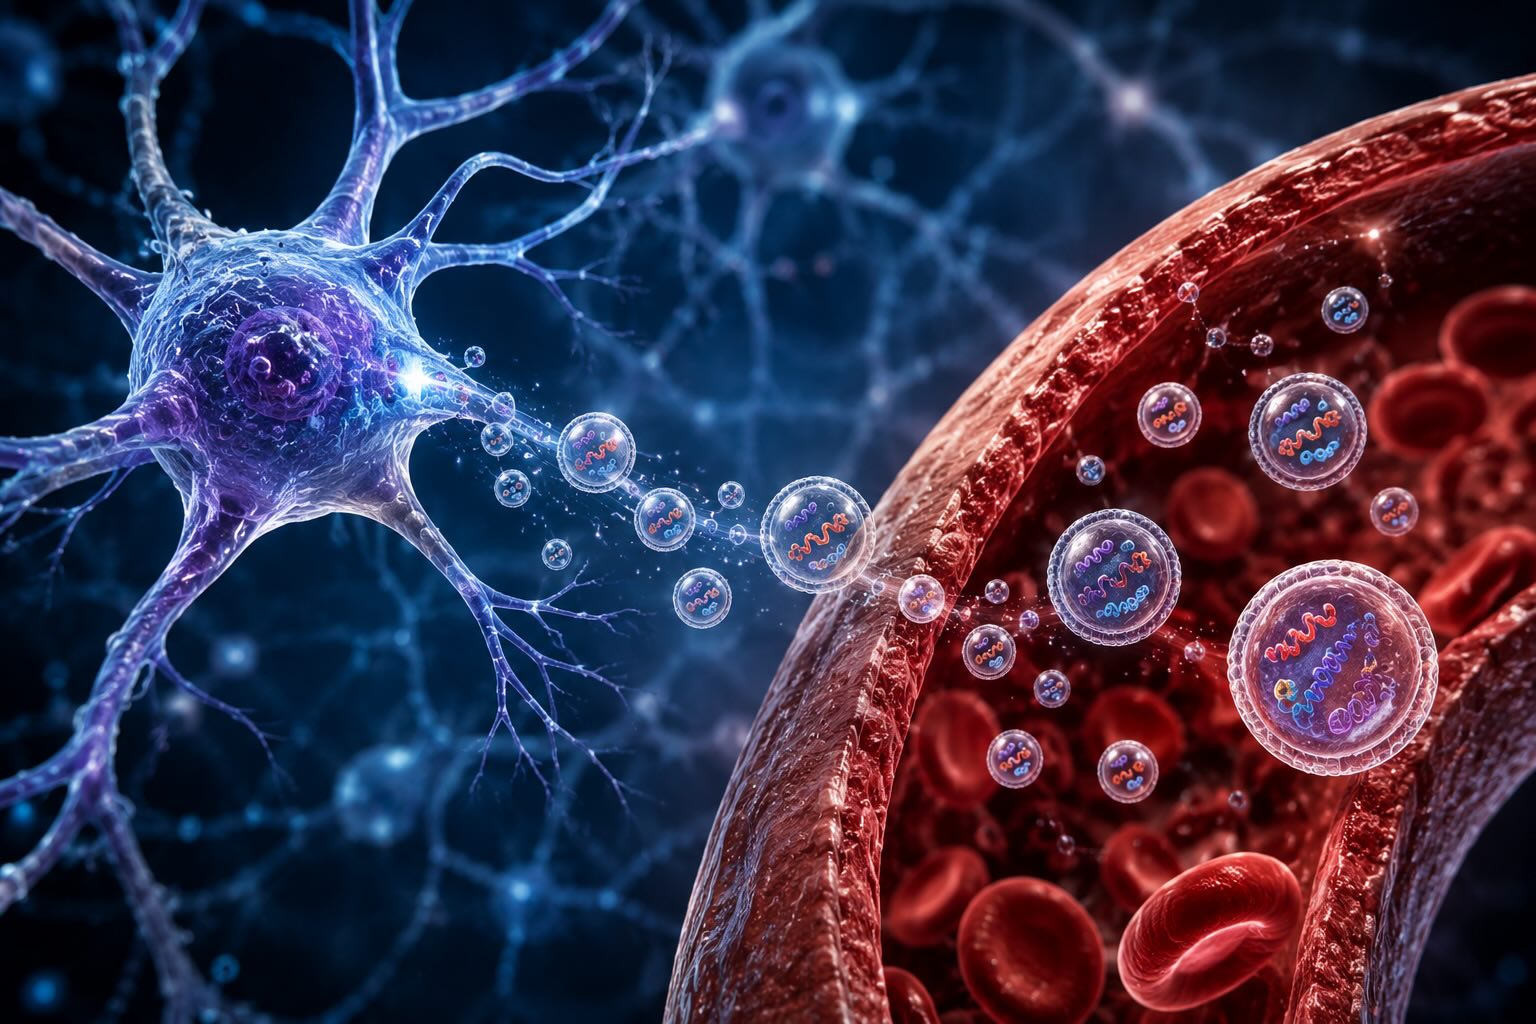
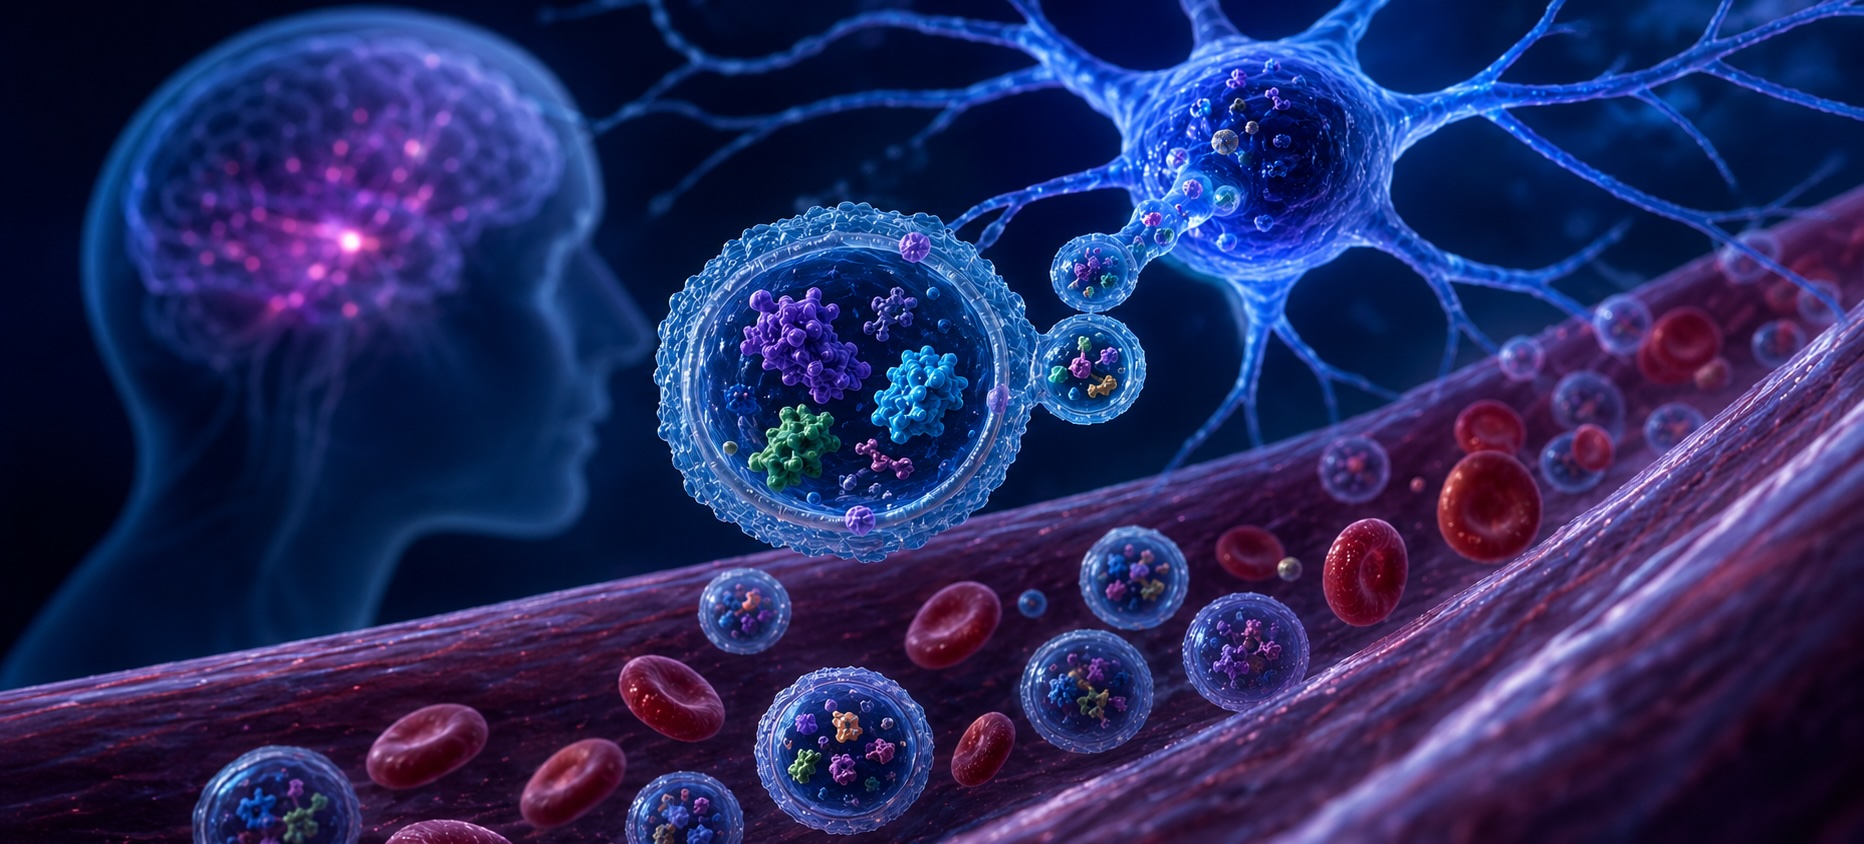
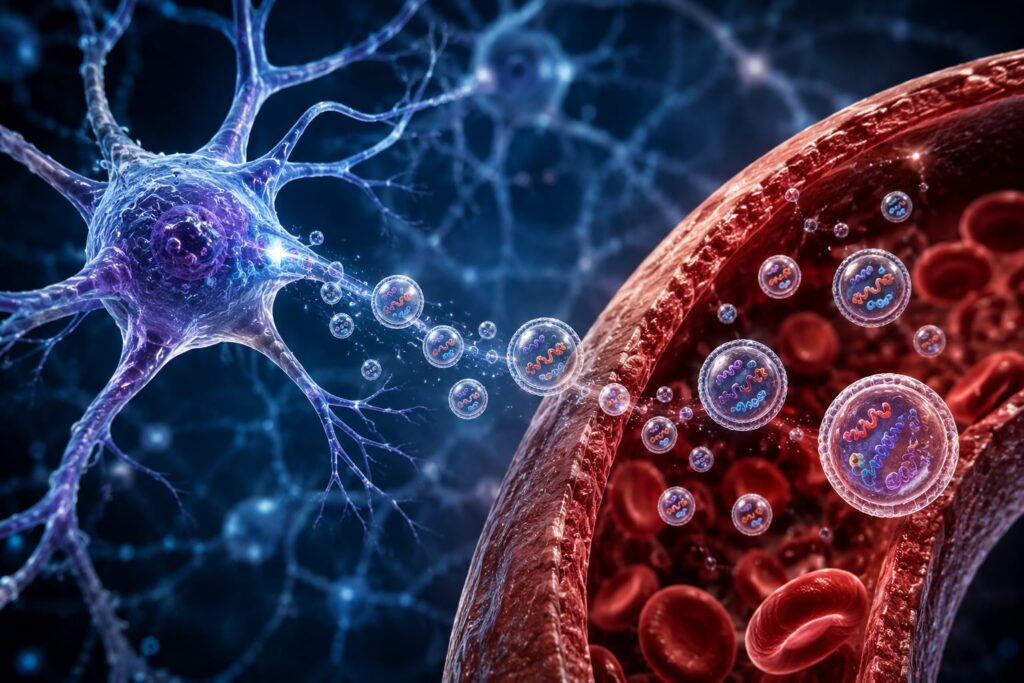
Neuron-Derived EVs: A Route to Compartment-Specific PD Signal
The conceptual problem with measuring CNS-specific biomarkers from blood is one of compartment access. The blood-brain barrier limits passive protein transfer. Most CNS-derived proteins that reach peripheral blood do so via injury, leakage, or non-specific clearance pathways — not via a mechanism that preserves the biochemical specificity researchers need for PD endpoints.
Extracellular vesicles (EVs) — lipid bilayer-enclosed particles released by cells into the extracellular space — offer a different route. Neurons release EVs constitutively as part of normal synaptic signaling, protein homeostasis, and intercellular communication [8]. These neuron-derived extracellular vesicles (NDEVs) carry cytoplasmic cargo from the cells that produced them: tau, phosphorylated tau isoforms, α-synuclein, TDP-43, and other proteins implicated in neurodegenerative disease pathology. Because NDEVs are enclosed in a membrane rather than free in solution, their cargo is protected from plasma proteases during transit from brain to peripheral blood.
The question that has historically limited NDEV utility is one of isolation specificity. EVs from all cell types are present in plasma — platelets, erythrocytes, endothelial cells, immune cells. Enriching for NDEVs specifically requires a surface marker that distinguishes neuronal EVs from the background. L1CAM (L1 cell adhesion molecule) is expressed on the surface of neurons and neural progenitor cells and has been used as a capture target for NDEV enrichment from plasma [9]. L1CAM-directed NDEV isolation enriches for a population carrying CNS-specific protein cargo, making the resulting fraction a more interpretable matrix for CNS PD biomarker measurement than total plasma.
Published data using L1CAM-enriched NDEV fractions from Alzheimer’s disease patients show that p-tau181, total tau, and Aβ42 concentrations in the NDEV fraction predict disease status and correlate with CSF biomarker values [10]. Goetzl et al. reported significant elevations in p-tau181 and reductions in Aβ42/Aβ40 ratio in NDEVs from MCI and AD patients compared to controls, with effect sizes comparable to CSF [9]. For α-synuclein and TDP-43, NDEV-based assays have demonstrated the ability to detect pathological protein forms in Parkinson’s disease and ALS patients respectively, in cases where direct plasma assay of the same targets showed insufficient sensitivity or specificity [11].
This is not a claim that NDEVs solve all CNS biomarker problems. It is a claim that for mechanistic PD monitoring — target engagement, pathway modulation, protein aggregate burden — NDEV-enriched fractions provide a more defensible CNS-specific signal than total plasma biomarkers.
NDEV transit mechanism from CNS to peripheral blood:
A Tiered Framework for Blood-Based CNS PK/PD Monitoring
Different trial phases and endpoint types require different levels of biomarker validation and different biomarker modalities. The framework below maps these dimensions explicitly, so teams can make a defensible selection rather than defaulting to whatever assay is easiest to run.
Phase I: Safety and Exposure-Response Characterization
In Phase I, the primary PK/PD questions are: does the drug reach the CNS, and does it produce any pharmacological effect at the target? For CNS exposure, PET imaging with appropriate ligands remains the gold standard where available. For pharmacological effect — particularly for drugs targeting tau, α-synuclein, or TDP-43 pathology — NDEV-based biomarkers can provide early mechanistic signal at Phase I sample sizes.
At Phase I, fit-for-purpose validation applies [12]. This means demonstrating assay precision and accuracy within the relevant concentration range, establishing reference ranges in the target population, and confirming that the biomarker shows expected directional change based on the drug’s mechanism. Full biomarker qualification is not required. The Lee et al. fit-for-purpose framework, codified by the biomarker qualification consortia, provides the operative standard [12].
Recommended Phase I blood-based PK/PD panel:
- NfL (safety/tolerability monitoring — axonal injury signal)
- GFAP (safety monitoring — astrogliosis signal)
- Target-specific NDEV cargo (mechanistic PD signal — e.g., p-tau181 for tau-targeting drugs, α-synuclein for PD/LBD programs, TDP-43 for ALS/FTD programs)
Phase II: Efficacy and Patient Stratification
Phase II requires more from a blood-based PK/PD strategy. The biomarker must be capable of supporting an efficacy claim or enriching a responder analysis. That raises the validation bar and changes which endpoints are interpretable.
For Alzheimer’s disease programs, plasma p-tau181 (direct or NDEV-enriched) now has sufficient published data to anchor a biomarker-defined patient enrichment strategy. Multiple studies have demonstrated that plasma p-tau181 above a defined threshold predicts Aβ-PET positivity with sensitivity and specificity exceeding 85% [7]. This is a usable enrichment tool at Phase II.
For Parkinson’s disease and LBD programs, exosome-based α-synuclein assay data are less mature but accumulating. The CNS specificity advantage of NDEV isolation is arguably larger in PD/LBD, where peripheral α-synuclein from enteric neurons and other non-CNS sources creates substantial background in direct plasma assays.
For ALS and FTD programs, NDEV TDP-43 detection represents one of the few blood-based routes to a mechanistically specific PD readout. Plasma total TDP-43 is highly confounded by platelet TDP-43, which is present at concentrations that mask the neuronal signal entirely [11]. NDEV enrichment removes the platelet-derived fraction from the measurement.
Multiplex EV immunoassay capability matters at Phase II. Running tau, p-tau181, α-synuclein, TDP-43, NfL, and GFAP simultaneously from a single NDEV isolation on 1 mL of plasma enables richer pharmacodynamic profiling without additional sample volume demands — an important consideration in pediatric or elderly patient populations. Platforms like LuminEV™ that support multiplexed EV cargo measurement allow teams to build a multi-analyte PD picture from each blood draw rather than committing to one or two markers per timepoint.
Phase III and Regulatory Submission
Biomarker qualification for regulatory use requires a substantially higher evidentiary standard than fit-for-purpose validation. The FDA Biomarker Qualification Program provides a structured pathway, and successful qualifications (NfL for monitoring neurodegeneration in SMA, for example) provide a template [13]. For most teams using blood-based CNS biomarkers today, qualification is a multi-year program that runs in parallel with drug development rather than preceding it.
The practical Phase III posture for blood-based CNS PK/PD monitoring is: primary endpoints remain imaging or CSF-based where regulators expect them; blood-based biomarkers serve as secondary endpoints, exploratory pharmacodynamic markers, and patient enrichment tools. The evidentiary contribution of blood-based markers accumulates across programs, building toward eventual qualification.
Pre-Analytical Variables That Break CNS PK/PD Assays
No framework for blood-based CNS PK/PD monitoring is complete without addressing pre-analytical variability. This is where most NDEV assays fail in multi-site trials — not because the biology is wrong, but because the sample handling protocol was not locked before the first patient was enrolled.
The critical pre-analytical variables for plasma NDEV assays:
Anticoagulant tube type. EDTA plasma is the standard matrix for EV biomarker work. Serum is not acceptable for most NDEV applications — the clotting process activates platelets and releases platelet-derived EVs that contaminate the EV fraction. Citrate tubes introduce dilution artifacts. EDTA, with standardized fill volume, is the required starting matrix.
Time to centrifugation. Whole blood should be centrifuged within 30–60 minutes of collection. Blood held at room temperature for extended periods shows progressive platelet activation and EV release, elevating background EV concentration and diluting the NDEV signal as a fraction of total EVs. Studies have demonstrated significant increases in total EV counts when processing is delayed beyond 2 hours [14].
Freeze-thaw cycles. EV membranes are susceptible to freeze-thaw damage. A single freeze-thaw cycle from −80°C is generally acceptable for most EV cargo proteins. Multiple cycles produce measurable losses in vesicle integrity and reduction in recoverable protein cargo. Sample aliquoting at the time of initial processing — not at the time of assay — is the correct protocol.
Isolation method standardization. For NDEV-specific analyses, the L1CAM enrichment protocol must be standardized across sites using the same antibody clone, incubation time, wash conditions, and elution method. Interlaboratory CVs for NDEV assays run above 25% when isolation protocols are not harmonized; with standardized protocols, CVs below 15% are achievable.
Locking these variables before first patient, first visit is not optional. A PK/PD dataset where sample handling was inconsistent across sites cannot support a meaningful pharmacodynamic interpretation, regardless of how sensitive the downstream assay is.
Practical Implementation: What to Specify in Your Trial Protocol
Blood-based CNS PK/PD monitoring requires explicit protocol specification to be reproducible. The following items must appear in the biomarker section of the trial protocol — not left to site discretion.
Matrix and collection: EDTA plasma, standard fill volume, processed within 30 minutes of collection. Centrifuge at 2,000 × g for 10 minutes at 4°C.
Aliquoting and storage: Aliquot into 0.5 mL volumes, labeled with visit, timepoint, and freeze date. Store at −80°C. Maximum 1 freeze-thaw cycle permitted.
Sampling schedule: Define blood draw timepoints aligned to PK sampling where possible. For NDEV PD monitoring, pre-dose, Tmax-adjacent, and trough draws at each visit provide minimum acceptable resolution. Dense early sampling (days 1, 3, 7 of dosing) enables exposure-response characterization.
Reference ranges: Establish pre-dose baseline NDEV biomarker values per patient. Individual-level change from baseline is a more interpretable PD metric than between-group comparison against a healthy control reference range, particularly in heterogeneous neurodegenerative disease populations.
Multiplexing plan: Specify which analytes will be measured from each NDEV isolation. Multiplex panels that include both mechanistic PD markers (p-tau181, α-synuclein, TDP-43 as appropriate to disease and MOA) and contextual markers (NfL, GFAP) from a single isolation provide the richest pharmacodynamic picture per blood draw.
Where the Field Is Heading
The trajectory is clear. Blood-based CNS biomarkers are moving from exploratory endpoints to primary stratification tools, and eventually to surrogate endpoints in select indications. Lecanemab’s regulatory approval pathway — in which amyloid-PET was a primary efficacy endpoint — will not be the template for the next wave of CNS drugs. The imaging burden, cost, and access constraints make PET-centric trial design increasingly untenable at Phase II scale.
The biomarker community is building toward plasma p-tau217 and NDEV-based multi-analyte panels as qualification-track candidates. The Alzheimer’s Association and FDA have convened working groups on blood biomarker qualification criteria [UNVERIFIED — confirm specific working group details before publishing]. For ALS and FTD, where imaging biomarkers are more limited, the case for blood-based PD endpoints is even stronger — and NDEV-based TDP-43 monitoring is one of the more mechanistically compelling options on the table.
Multi-analyte approaches will likely define the next generation of CNS PD monitoring. A panel that simultaneously tracks neuronal protein homeostasis (p-tau181, TDP-43), synaptic integrity (synaptotagmin, SNAP25 in NDEVs), and glial response (GFAP) from a single blood draw gives a pharmacodynamic fingerprint that no single marker can provide. The assay infrastructure to support this — sensitive, reproducible, multiplexed EV immunoassay platforms — exists now. The clinical programs that adopt this infrastructure earliest will generate richer data, more interpretable PK/PD relationships, and ultimately more confident go/no-go decisions.
References
[1] Blennow K, de Leon MJ, Zetterberg H. Alzheimer’s disease. Lancet. 2006;368(9533):387–403. https://doi.org/10.1016/S0140-6736(06)69113-7
[2] Turnbull DK, Shepherd DB. Post-dural puncture headache: pathogenesis, prevention and treatment. Br J Anaesth. 2003;91(5):718–729. https://doi.org/10.1093/bja/aeg231
[3] Bateman RJ, Wen G, Morris JC, Holtzman DM. Fluctuations of CSF amyloid-β levels: implications for a diagnostic and therapeutic biomarker. Neurology. 2007;68(9):666–669. https://doi.org/10.1212/01.wnl.0000256043.55845.2f
[4] Khalil M, Teunissen CE, Otto M, et al. Neurofilaments as biomarkers in neurological disorders. Nat Rev Neurol. 2018;14(10):577–589. https://doi.org/10.1038/s41582-018-0058-z
[5] Gaetani L, Blennow K, Calabresi P, et al. Neurofilament light chain as a biomarker in neurological disorders. J Neurol Neurosurg Psychiatry. 2019;90(8):870–881. https://doi.org/10.1136/jnnp-2018-320106
[6] Bogoslovsky T, Wilson D, Chen Y, et al. Increases of plasma levels of glial fibrillary acidic protein, tau, and amyloid β up to 90 days after traumatic brain injury. J Neurotrauma. 2017;34(1):66–73. https://doi.org/10.1089/neu.2015.4333
[7] Janelidze S, Mattsson N, Palmqvist S, et al. Plasma P-tau181 in Alzheimer’s disease: relationship to other biomarkers, differential diagnosis, neuropathology and longitudinal progression to Alzheimer’s dementia. Nat Med. 2020;26(3):379–386. https://doi.org/10.1038/s41591-020-0755-1
[8] Colombo M, Raposo G, Théry C. Biogenesis, secretion, and intercellular interactions of exosomes and other extracellular vesicles. Annu Rev Cell Dev Biol. 2014;30:255–289. https://doi.org/10.1146/annurev-cellbio-101512-122326
[9] Goetzl EJ, Mustapic M, Kapogiannis D, et al. Cargo proteins of plasma astrocyte-derived exosomes in Alzheimer’s disease. FASEB J. 2016;30(11):3853–3859. https://doi.org/10.1096/fj.201600756R
[10] Fiandaca MS, Kapogiannis D, Mapstone M, et al. Identification of preclinical Alzheimer’s disease by a profile of pathogenic proteins in neurally derived blood exosomes: a case-control study. Alzheimers Dement. 2015;11(6):600–607.e1. https://doi.org/10.1016/j.jalz.2014.09.018
[11] Feneberg E, Steinacker P, Lehnert S, et al. Limited role of free TDP-43 as a diagnostic tool in neurodegenerative diseases. Amyotroph Lateral Scler Frontotemporal Degener. 2014;15(5–6):351–356. https://doi.org/10.3109/21678421.2014.905606 [UNVERIFIED — please confirm before publishing]
[12] Lee JW, Devanarayan V, Barrett YC, et al. Fit-for-purpose method development and validation for successful biomarker measurement. Pharm Res. 2006;23(2):312–328. https://doi.org/10.1007/s11095-005-9045-3
[13] FDA. Biomarker Qualification: Evidentiary Framework. Guidance for Industry and FDA Staff. 2018. https://www.fda.gov/media/119mind/download [UNVERIFIED — confirm direct URL before publishing]
[14] Lacroix R, Judicone C, Mooberry M, et al. Standardization of pre-analytical variables in plasma microparticle determination: results of the International Society on Thrombosis and Haemostasis SSC Collaborative workshop. J Thromb Haemost. 2013;11(6):1190–1193. https://doi.org/10.1111/jth.12207