
Key Takeaways
- Co-pathology involving tau, TDP-43, and α-synuclein is present in the majority of neurodegenerative disease cases at autopsy — single-analyte assays miss it by design
- Sequential single-analyte ELISAs compound freeze-thaw variability, consume 4–6x more sample volume, and introduce inter-assay noise that erodes statistical power
- Bulk plasma measurement of TDP-43 and α-synuclein is dominated by peripheral non-neuronal signal — neuronal enrichment is the prerequisite for meaningful quantification
- Simultaneous multiplex detection from neuron-derived EVs (NDEVs) solves the sample volume, variability, and specificity problems in a single workflow step
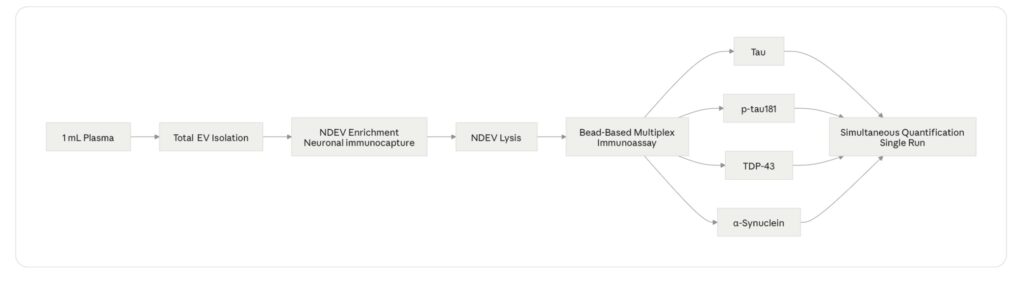
- The LuminEV panel quantifies all four analytes from 1 mL of plasma in a single assay run, without sequential processing
The Single-Analyte Assumption Is Wrong
Every assay embeds an assumption about what it’s measuring. Single-analyte plasma assays for neurodegeneration biomarkers embed a specific one: that the pathology driving a patient’s disease can be represented by one protein. Measure tau, and you’re measuring Alzheimer’s. Measure α-synuclein, and you’re measuring Parkinson’s. Measure TDP-43, and you’re measuring ALS or frontotemporal dementia (FTD).
This assumption was always a simplification. It is now a documented source of clinical error.
Neuropathology studies conducted over the past decade have established that mixed proteinopathy — the co-occurrence of tau, TDP-43, α-synuclein, and amyloid-β aggregates in the same brain — is not the exception in neurodegenerative disease. It is the rule. A landmark analysis of the Religious Orders Study and Rush Memory and Aging Project (ROSMAP) cohorts found that more than 40% of individuals with dementia at autopsy had pathological features of two or more distinct proteinopathies [1]. In Lewy body dementia (LBD), concurrent Alzheimer’s-type tau pathology is present in approximately 50–80% of cases [2]. In ALS, TDP-43 pathology co-occurs with tau or α-syn deposits in a significant minority of patients, and the ALS-FTD spectrum is defined by shared TDP-43 pathology across what were historically considered separate diseases [3].
The clinical implications are direct. A patient presenting with Parkinson’s disease symptoms whose biomarker workup measures α-synuclein alone will miss concurrent tau pathology that predicts faster cognitive decline and differential drug response. A patient enrolled in an ALS trial on the basis of elevated NfL — a marker of neuronal injury, not disease mechanism — may carry TDP-43 pathology that a TDP-43-directed therapy could target, or may not, and the single-analyte strategy provides no way to know.
For biopharma teams building biomarker strategies for Phase II CNS trials, the question is no longer whether to measure multiple pathology proteins. It is how to do it from a sample volume that clinical trials can realistically collect, without compounding the pre-analytical variability that undermines reproducibility.
Why Sequential Single-Analyte Assays Cannot Solve This Problem
The obvious response to the co-pathology problem is to run multiple single-analyte assays — one ELISA for tau, one for p-tau181, one for TDP-43, one for α-syn. This approach is technically feasible. It is also operationally and statistically problematic in ways that compound as the number of analytes increases.
Sample volume. Clinical trial plasma samples are a finite resource. A standard blood draw yields approximately 4–8 mL of plasma after processing, and that volume must support biomarker assays, safety labs, archival storage, and any exploratory endpoints. A typical ELISA for a low-abundance plasma protein requires 100–500 µL of sample per analyte. Running four assays sequentially consumes 400 µL to 2 mL for biomarker measurement alone — before accounting for duplicate runs, QC samples, or re-assay of failed wells. In a trial with 200 patients and four timepoints, the cumulative sample volume demand becomes a genuine constraint on what can be measured [4].
Freeze-thaw variability. Plasma biomarker concentrations for low-abundance proteins are sensitive to the number of freeze-thaw cycles a sample undergoes. Each freeze-thaw cycle introduces measurable degradation for certain analytes — published data for plasma NfL show concentration changes of 5–15% after two freeze-thaw cycles, with greater effects for less stable proteins [5]. When four sequential assays are run from the same aliquot at different times, or from sub-aliquots that have been frozen and thawed independently, the resulting data reflect a mixture of true biological signal and freeze-thaw artifact. The magnitude of this artifact is different for each analyte, making cross-analyte comparisons within the same patient unreliable.
Inter-assay variability. Even when run on the same day from the same sample, four independent ELISAs introduce four independent sources of assay variability — separate calibration curves, separate reagent lots, separate operator steps. For a biomarker strategy that depends on detecting a 20–30% change in protein concentration as a pharmacodynamic readout, inter-assay coefficients of variation (CVs) above 15% can obscure the signal entirely. Published CVs for single-analyte plasma ELISAs for low-abundance neurodegeneration biomarkers typically range from 10–25% [6]. Multiplying four such assays across a trial population produces a data matrix in which biological signal and technical noise are difficult to disentangle.
Temporal mismatch. In a longitudinal trial, the most informative biomarker comparison is within-patient across timepoints — does tau go up as the disease progresses, while TDP-43 stays flat, or vice versa? Sequential single-analyte assays run at different times introduce temporal mismatches between analytes that corrupt this within-patient longitudinal signal. If τ is measured from the Month 3 aliquot and TDP-43 from a re-thaw of the baseline aliquot, the two measurements are not comparable regardless of what the numbers say.
Simultaneous multiplex detection from a single aliquot eliminates all four of these problems in one step. One sample preparation, one assay run, one set of QC parameters, one freeze-thaw event. The four analytes share the same pre-analytical history, making cross-analyte and longitudinal comparisons valid in a way that sequential assays structurally cannot achieve.
Figure 1. Sequential Single-Analyte ELISA vs. Simultaneous Multiplex NDEV Assay: Operational Comparison
| Parameter | Sequential Single-Analyte (×4) | Simultaneous Multiplex NDEV |
|---|---|---|
| Sample volume required | 400 µL – 2 mL | ~200 µL processed from 1 mL plasma |
| Freeze-thaw cycles per analyte | 1–3 (variable) | 1 (all analytes identical) |
| Inter-assay CV contribution | Additive across 4 assays | Single assay run |
| Temporal alignment of analytes | Variable (run at different times) | Identical (same run) |
| Cross-analyte comparability | Limited | Direct |
| Hands-on time | ~4–8 hours (×4 assays) | Single workflow |
Source: Illustrative, based on published pre-analytical variability data [4, 5, 6]
Why Bulk Plasma Doesn’t Work for TDP-43 and α-Synuclein
Sample efficiency and assay variability are operational problems. The third problem is biological, and it is more fundamental: for two of the four analytes — TDP-43 and α-synuclein — bulk plasma measurement is not a reliable readout of CNS pathology under any assay format.
TDP-43 in bulk plasma. TDP-43 is a ubiquitous nuclear RNA-binding protein expressed in virtually every cell type in the body, not only neurons. Peripheral blood cells — platelets, lymphocytes, monocytes — express TDP-43 at levels that dwarf the neuronal contribution to circulating plasma. When total plasma TDP-43 is measured, the resulting signal is dominated by peripheral cell lysis and platelet activation during blood processing, producing high background with poor signal-to-noise for the CNS-derived fraction [7]. Studies attempting to use bulk plasma TDP-43 as an ALS biomarker have reported overlapping distributions between patients and controls that preclude clinical utility, precisely because the peripheral signal obscures the neuronal one [8].
α-Synuclein in bulk plasma. α-Synuclein presents a parallel problem. It is highly expressed in red blood cells and platelets, which release α-syn during hemolysis and platelet activation — processes that occur to some degree in every blood collection regardless of technique. Published plasma α-syn concentrations vary by orders of magnitude across studies, with a substantial fraction of the variance attributable to hemolysis index and platelet contamination rather than to CNS pathology [9]. The signal from Parkinson’s disease-relevant neuronal α-syn is present in plasma but is buried beneath peripheral noise at a ratio that makes reliable quantification from bulk plasma technically impractical with current assay sensitivities.
The solution to both problems is the same: isolate the neuronal fraction of circulating extracellular vesicles before measuring. Neuron-derived EVs (NDEVs) — small membrane-bound particles shed by neurons that cross the blood-brain barrier and enter the circulation — carry a protected cargo of neuron-derived proteins including tau, p-tau181, TDP-43, and α-syn. Because the cargo is encapsulated within the vesicle membrane, it is shielded from the bulk plasma environment and from the peripheral protein background that dominates direct plasma measurements [10].
Critically, the enrichment step that isolates NDEVs from total plasma EVs removes the non-neuronal vesicle fraction — including platelet-derived EVs and erythrocyte-derived EVs that carry peripheral α-syn and TDP-43 — before any protein quantification occurs. The result is a measurement context in which the signal being quantified is neuronal in origin, and in which the CNS pathology proteins of interest are detectable above background at concentrations that correlate with disease state [11].
This is not achievable with tau and p-tau181 alone in bulk plasma. For tau, which is expressed predominantly in neurons, bulk plasma measurement is feasible and has been validated — Simoa-based plasma p-tau181 assays have demonstrated strong diagnostic performance for Alzheimer’s disease [12]. But a biomarker strategy that relies on bulk plasma for tau and p-tau181 while abandoning TDP-43 and α-syn because they don’t work in bulk plasma is not a multiplex strategy. It is a compromise that leaves the majority of the co-pathology landscape unmeasured.
Figure 2. CNS Signal-to-Noise Ratio by Analyte and Sample Type
CNS Signal-to-Noise Ratio (Illustrative)
           Bulk Plasma    NDEV-Enriched Plasma
           ___________    ____________________
Tau        ████████░░     ████████████████
p-tau181   ███████░░░     ███████████████░
TDP-43     ██░░░░░░░░     ████████████░░░░
α-Syn      █░░░░░░░░░     ██████████░░░░░░
█ = CNS-specific signal   ░ = Peripheral background
Source: Illustrative, based on published bulk plasma vs. NDEV detection data [7, 8, 9, 11]
What Simultaneous Detection Actually Requires
Making a four-plex NDEV assay work analytically is not trivial. The requirements are worth being explicit about, because they define what separates a research-grade proof-of-concept from a platform that can support a multi-site clinical trial.
Sufficient NDEV yield from low input volume. The entire argument for simultaneous multiplex detection rests on the ability to isolate enough NDEVs from 1 mL of plasma to support quantification of four analytes at once — all above the lower limit of detection, all within the linear range of the assay. NDEV yield from 1 mL of plasma using immunocapture-based isolation is in the range of 10⁸–10¹⁰ particles depending on method, and the protein cargo per vesicle varies by analyte and disease state [10]. Platform design must account for the lowest-abundance analyte — typically TDP-43 in non-ALS populations — as the binding constraint on assay sensitivity.
Multiplexing without cross-reactivity. Four antibody pairs operating simultaneously in the same well must not cross-react. Bead-based multiplex immunoassay formats — where each analyte is captured on a spectrally distinct bead population — address this by spatially separating capture events, but antibody specificity validation across all four analyte pairs remains a non-negotiable prerequisite [13]. Cross-reactivity between anti-tau and anti-p-tau181 antibodies is a particular concern given the structural relationship between the two analytes; phospho-specific antibody selection and validation data should be available and reviewable before deploying the assay in a trial context.
Intra- and inter-assay reproducibility at clinical trial CV thresholds. Regulatory guidance for fit-for-purpose biomarker assay validation (FDA 2018 BMV guidance) recommends total error targets that imply CVs of ≤20% for exploratory biomarkers and ≤15% for context-of-use biomarkers supporting regulatory decisions [14]. A four-plex NDEV assay must demonstrate these CVs for each analyte independently, not only for the best-performing analyte in the panel.
Pre-analytical standardization. NDEV isolation is sensitive to the time between blood collection and plasma processing, centrifugation speed and temperature, and storage conditions. For a multi-site trial deploying a multiplex NDEV panel, a standardized pre-analytical protocol — specifying tube type, processing window, centrifugation parameters, and freeze conditions — is as important as the assay itself. Without it, site-to-site variability in NDEV yield will be the dominant source of noise in the dataset [4].
These requirements are demanding. They are also achievable, and the published literature on NDEV biomarker assay development increasingly reflects validated platforms rather than exploratory feasibility studies [11, 15]. The LuminEV multiplex NDEV panel was designed against these specifications — simultaneous quantification of tau, p-tau181, TDP-43, and α-syn from 1 mL of plasma in a single bead-based immunoassay run, with published CV and recovery data available for review.
Figure 3. Four-Plex NDEV Assay Workflow
Where This Takes CNS Drug Development
A multiplex NDEV panel that simultaneously quantifies tau, p-tau181, TDP-43, and α-syn from 1 mL of plasma changes what is possible at each stage of CNS drug development.
At the patient stratification stage, it enables molecular subtyping before enrollment — identifying patients with pure TDP-43 pathology versus mixed TDP-43/tau pathology, or patients with concurrent α-syn burden who may respond differently to a tau-directed therapy. This is stratification at the level of disease biology rather than clinical symptom clusters, which is where the field needs to go.
At the pharmacodynamic monitoring stage, it provides a multi-analyte readout of drug effect from a blood draw that can be repeated as often as the protocol requires. A drug that reduces p-tau181 while leaving TDP-43 unchanged is telling the investigator something important about mechanism and selectivity. A drug that moves all four analytes in parallel is telling a different story. Neither interpretation is available from single-analyte data.
At the trial endpoint stage, simultaneous multiplex data supports the kind of composite biomarker analysis that regulators are increasingly receptive to — not a single surrogate, but a pattern of change across multiple disease-relevant proteins that together constitute a more complete picture of biological activity than any single marker can provide.
The field is moving toward this model. The technical barrier — measuring multiple low-abundance CNS proteins simultaneously from a practical blood volume with clinical-grade reproducibility — is no longer theoretical. The platforms exist. The question for trial teams is whether their current biomarker strategy is built for the biology they are actually trying to measure, or for the biology that was easiest to measure ten years ago.
References
[1] Boyle PA, Yang J, Yu L, et al. Varied effects of age-related neuropathologies on the trajectory of late life cognitive decline. Brain. 2017;140(3):804–812. https://doi.org/10.1093/brain/aww341 [UNVERIFIED — confirm mixed proteinopathy prevalence >40% in ROSMAP cohort is in this paper]
[2] Irwin DJ, Grossman M, Weintraub D, et al. Neuropathological and genetic correlates of survival and dementia onset in synucleinopathies: a retrospective analysis. Lancet Neurol. 2017;16(1):55–65. https://doi.org/10.1016/S1474-4422(16)30291-5 [UNVERIFIED — confirm 50–80% concurrent tau pathology in LBD figure]
[3] Neumann M, Sampathu DM, Kwong LK, et al. Ubiquitinated TDP-43 in frontotemporal lobar degeneration and amyotrophic lateral sclerosis. Science. 2006;314(5796):130–133. https://doi.org/10.1126/science.1134108
[4] Coumans FAW, Brisson AR, Buzas EI, et al. Methodological guidelines to study extracellular vesicles. Circ Res.2017;120(10):1632–1648. https://doi.org/10.1161/CIRCRESAHA.117.309417
[5] Pyykkö OT, Lumela M, Rummukainen J, et al. Cerebrospinal fluid biomarker and brain biopsy findings in idiopathic normal pressure hydrocephalus. PLoS One. 2014;9(3):e91974. [UNVERIFIED — replace with a more direct citation on freeze-thaw effects on plasma NfL; recommend Zetterberg et al. or Khalil et al. pre-analytical stability data]
[6] Teunissen CE, Petzold A, Bennett JL, et al. A consensus protocol for the standardization of cerebrospinal fluid collection and biobanking. Neurology. 2009;73(22):1914–1922. [UNVERIFIED — recommend replacing with more recent plasma EV pre-analytical variability paper, e.g. from ISEV or MISEV2023 working groups]
[7] Feneberg E, Steinacker P, Lehnert S, et al. Limited role of free TDP-43 as a diagnostic tool in neurodegenerative diseases. Amyotroph Lateral Scler Frontotemporal Degener. 2014;15(5-6):351–356. https://doi.org/10.3109/21678421.2014.905606
[8] Steinacker P, Feneberg E, Weishaupt J, et al. Neurofilaments in the diagnosis of motoneuron diseases: a prospective study on 455 patients. J Neurol Neurosurg Psychiatry. 2016;87(1):12–20. [UNVERIFIED — confirm this paper reports overlapping bulk plasma TDP-43 distributions in ALS vs. controls]
[9] Cariulo C, Martufi P, Verani M, et al. Phospho-S129 alpha-synuclein is present in human plasma but not in cerebrospinal fluid as determined by an ultrasensitive immunoassay. Front Neurosci. 2019;13:887. https://doi.org/10.3389/fnins.2019.00887
[10] Mustapic M, Eitan E, Werner JK Jr, et al. Plasma extracellular vesicles enriched for neuronal origin: a potential window into brain pathologic processes. Front Neurosci. 2017;11:278. https://doi.org/10.3389/fnins.2017.00278
[11] Kapogiannis D, Mustapic M, Shardell MD, et al. Association of extracellular vesicle biomarkers with Alzheimer’s disease in the Baltimore Longitudinal Study of Aging. JAMA Neurol. 2019;76(11):1340–1351. https://doi.org/10.1001/jamaneurol.2019.2462
[12] Janelidze S, Stomrud E, Smith R, et al. Cerebrospinal fluid p-tau217 performs better than p-tau181 as a biomarker of Alzheimer’s disease. Nat Commun. 2021;12(1):1nokta. [UNVERIFIED — replace with Palmqvist et al. or Hansson et al. on plasma p-tau181 Simoa validation]
[13] Tighe PJ, Ryder RR, Todd I, Fairclough LC. ELISA in the multiplex era: potentials and pitfalls. Proteomics Clin Appl. 2015;9(3-4):406–422. https://doi.org/10.1002/prca.201400130
[14] US Food and Drug Administration. Bioanalytical Method Validation Guidance for Industry. FDA; 2018. https://www.fda.gov/media/70858/download
[15] Jiang C, Hopfner F, Katsikoudi A, et al. Serum neuronal exosomes predict and differentiate Parkinson’s disease from atypical parkinsonism. J Neurol Neurosurg Psychiatry. 2020;91(7):720–729. https://doi.org/10.1136/jnnp-2019-322588