


Inconsistent results are the most common complaint about any EV secretion assay. Run-to-run variability in exosome and extracellular vesicle release measurements is usually blamed on the biology, but four specific causes account for most of it: a readout based on total particle count rather than vesicle subpopulations, unmeasured changes in cell viability, drift in cell culture and conditioned medium collection conditions, and the EV isolation step itself. Three are design choices that can be fixed before a screening campaign starts. This guide covers each cause, how to control it, and what to measure instead of particle number.
Key Takeaways
- Most inconsistency in an EV secretion assay traces to four causes, and three of them are design choices rather than bad luck.
- Extracellular vesicle (EV) release runs through several distinct pathways, and a compound usually hits one of them rather than all [1].
- CD9, CD63 and CD81 are not interchangeable markers: they track different vesicle populations with different biogenesis routes, so a single-marker readout can look unstable when it is simply incomplete [2].
- Two laboratories reached opposite conclusions about the same compound, and protocol differences were a documented candidate cause [3,4].
- Measuring several surface markers directly in conditioned medium removes the preparation step and makes a flat result interpretable.
Why is my EV secretion assay inconsistent?
An EV secretion assay usually gives inconsistent results for four reasons: the readout measures total particles rather than which vesicles changed, cell health varies between runs, culture and collection conditions drift, and the sample preparation step adds its own variability. Each is controllable, and the first is the one most often missed.
EVs are membrane-bound particles released by cells into the surrounding fluid, and their surface proteins reflect both the cell of origin and the route by which they formed. That second point is where most of the apparent inconsistency comes from, so it is worth understanding before changing anything else about the protocol.
Why EV release became a drug target
Two bodies of work pushed EV secretion from cell biology into pharmacology. In oncology, tumour-derived vesicles carry signals that remodel the microenvironment and contribute to chemoresistance, which made blocking their release an attractive adjunct strategy. In neurodegeneration, vesicles are implicated in the cell-to-cell spread of misfolded proteins. Asai and colleagues showed that microglia spread tau through exosome secretion, and that inhibiting exosome synthesis significantly reduced tau propagation both in vitro and in vivo, concluding that the exosome secretion pathway may be a therapeutic target [5].
The screening effort followed. Datta and colleagues built a quantitative high-throughput assay in prostate cancer cells carrying a fluorescent vesicle marker and screened 4,580 compounds from two libraries. Twenty-two were identified as potent activators or inhibitors, and lead compounds were separated into inhibitors and activators of vesicle biogenesis or secretion [6]. Reviews now catalogue dozens of compounds reported to interfere with EV biogenesis across cancer, neurodegeneration, inflammation and infectious disease [7,8].
Underneath these programmes sits a biological fact that complicates the screening readout. Vesicles are not made one way. Trajkovic and colleagues showed that transfer of exosome-associated membrane domains into the endosomal lumen did not depend on the ESCRT (endosomal sorting complex required for transport) machinery but required the sphingolipid ceramide, and that vesicle release fell when neutral sphingomyelinases were inhibited [1]. Other vesicles bud directly from the plasma membrane. A compound acting on one route leaves the others largely untouched.
Cause 1: the readout can’t see which vesicles changed
Particle counting is fast and quantitative, which is why it anchors most secretion assays. It has three weaknesses that matter specifically in a screening context.
Subpopulation-selective effects cancel out
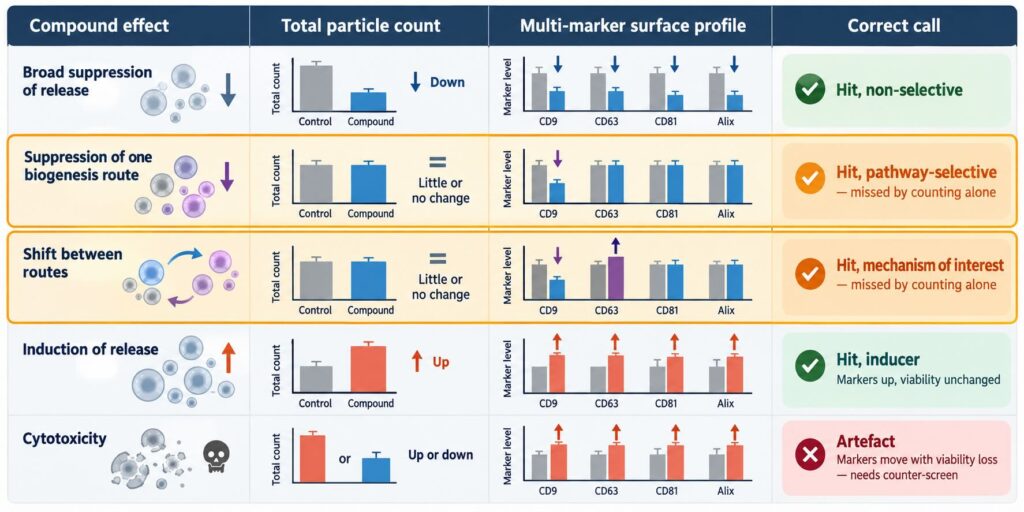
If a compound suppresses endosome-derived vesicles while plasma-membrane-derived release continues unchanged, the total may barely move. The screen scores a miss. This is not hypothetical: the two routes are separable experimentally, and they respond differently to perturbation. Mathieu and colleagues tracked CD9 and CD63 and found them on two distinct vesicle populations plus one shared one, with release of the CD63-bearing, late-endosomal population specifically susceptible to neutralizing endosomal pH. CD81, often used interchangeably as a small-EV marker, behaved more like CD9 than like CD63 [2]. A readout that collapses all vesicles into one number discards exactly the distinction a mechanism-of-action question depends on.
Cause 2: dying cells look like active compounds
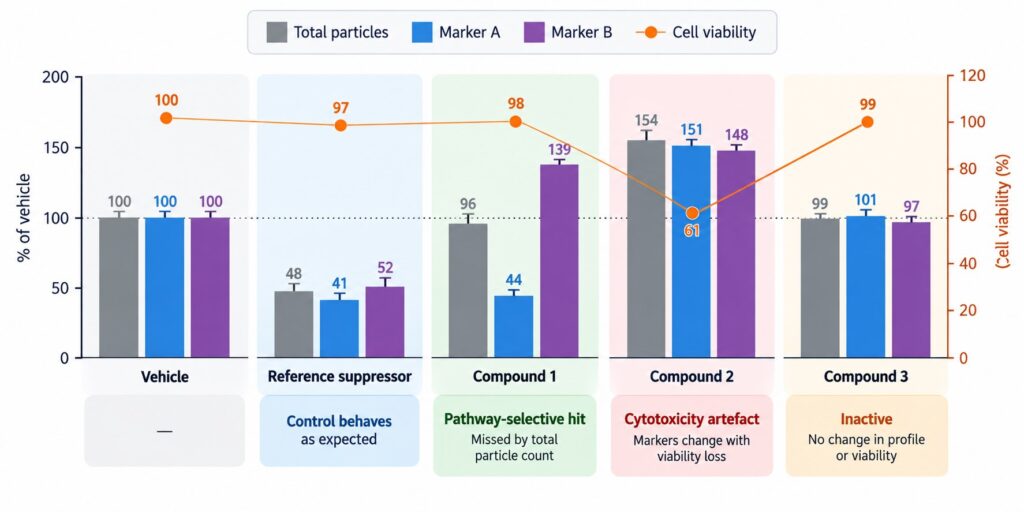
Stressed and apoptotic cells shed membrane material that falls within the size range counted as vesicles. Without a parallel viability measure, a cytotoxic compound can register as a secretion inducer, and a compound that merely slows proliferation can look like an inhibitor because fewer cells released fewer vesicles. Normalizing to cell number is necessary but not sufficient, because the debris itself is being counted.
Causes 3 and 4: culture conditions and sample preparation
Counting methods generally require a prepared sample, which caps how many conditions can be processed per day and introduces a preparation step that varies between runs. Protocol sensitivity is not a theoretical concern here. After one group reported that an antibiotic inhibited small-EV secretion in breast cancer cells, a second group reported that the same compound did not inhibit secretion in their hands, and noted that differences in the isolation protocol could have contributed to the divergent results [3]. The original authors replied with further pharmacological and genetic evidence supporting their finding, and raised a separate methodological point about the vesicle-depleted serum used in the culture medium [4]. Whichever reading is right, the exchange shows how much weight sample handling carries in this field.
One marker is a coin flip
Teams aware of the subpopulation problem sometimes respond by switching from particle counting to a single-marker immunoassay. That is an improvement, but it narrows the problem rather than solving it. The screen now reports one vesicle population accurately and says nothing about the others, so the probability of detecting a given compound depends on whether the chosen marker happens to sit on the population that compound affects.
Because CD81 tracks with CD9 rather than CD63 in the cells where this has been examined [2], choosing CD9 or CD81 as the single readout samples much the same population twice over, while a compound acting on the late-endosomal route goes unseen either way. The inverse holds for a CD63-only screen. The marker choice is made before any data exist, which is precisely when a team knows least about which pathway its library will hit.
Measuring several markers from the same well removes that gamble. It also changes what a negative result means. In a single-marker screen, “no change” is ambiguous: it could mean the compound is inactive, or that it acted on a population the assay cannot see. With a panel, a flat profile across markers is evidence of inactivity rather than an absence of evidence, which matters when a programme is deciding which chemical series to drop.
Tetraspanin profiles as a pathway-resolved readout
The tetraspanins CD9, CD63 and CD81 are the most widely measured EV surface proteins, and MISEV2023 treats protein markers as a core element of EV characterization [9]. Their value in a secretion screen comes from the fact that they are not redundant. Because they partition differently between the plasma membrane and late endosomal compartments [2], the ratio between them carries information about which release route a compound touched.
Read this way, a screen produces a profile rather than a number. A compound that shifts the CD63 fraction while leaving the others flat points toward the endosomal route. A compound that moves all three together suggests something broader, such as an effect on membrane turnover or on cell health. Neither call can be made from a single total. Our tetraspanin guide covers the underlying biology in more depth.
This is why a result can look unstable without being unstable. A single-marker readout tracking one population will swing with any condition that shifts the balance between routes, even when total release is steady and the compound effect is real and reproducible.
The practical question is how to get that profile at screening throughput. Isolation-based identity methods add a preparation step whose own variability lands on top of the biological effect, and they do not scale to plate-based work. The LuminEV assay was developed to measure EV surface proteins without that step: intact vesicles are captured on antibody-coated beads directly from culture supernatant or biofluid, and a second surface protein is detected on the same vesicle, so several markers are read from one well. In the validation study, the assay detected both pharmacological suppression and induction of EV release from cultured cells using tetraspanin levels as the readout [10]. (Disclosure: that study was led by the team that develops LuminEV, with academic co-authors.)
Designing the assay so results hold up
A multi-marker readout only pays off inside a screen designed to interpret it. Five elements matter most.
1. Run reference modulators on every plate
Include a known suppressor and a known inducer of release as plate controls, chosen for the pathway the programme cares about: a neutral sphingomyelinase inhibitor addresses the ceramide-dependent route [1], while agents that neutralize endosomal pH act preferentially on the late-endosomal population [2]. Without both directions represented, the dynamic range of the assay is unknown.
2. Fix the medium and the collection window before you start
Serum contributes vesicles of its own, and depletion procedures alter the background. Collection time, confluence and medium composition all change what cells release. These variables are a documented source of disagreement between laboratories [3,4], so they should be locked and reported, not optimized mid-campaign. The differences between conditioned media and plasma as sample types are covered in our article on plasma vs. cell culture EVs.
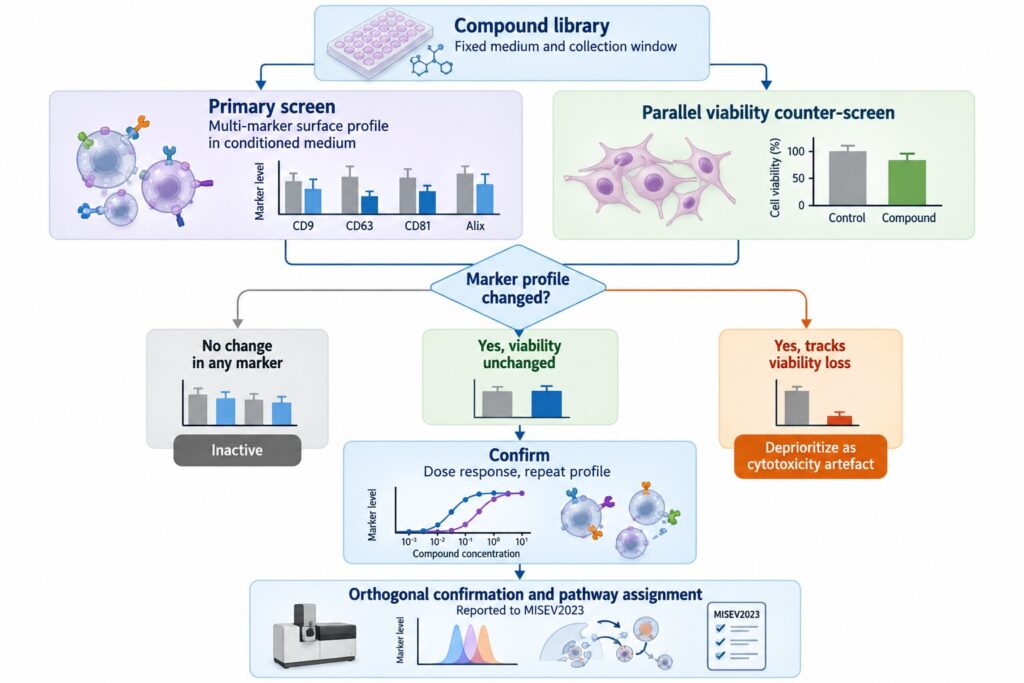
3. Pair every secretion measurement with viability
Run a viability counter-screen on a parallel plate at the same timepoint and compound concentration. Hits whose marker changes track viability loss are deprioritized. This is the single most effective way to reduce the false-positive rate in a secretion screen.
4. Normalize deliberately, and say how
Marker signal per well depends on cell number. Normalizing to viable cell count separates per-cell secretion changes from changes in population size. Report the normalization, since a profile normalized one way is not comparable to one normalized another way.
5. Confirm hits orthogonally
A primary multi-marker screen is a filter, not a conclusion. Confirmed hits should be re-tested with an independent method and reported against MISEV2023, which sets out the minimum information needed to judge whether a measured signal genuinely reflects vesicles [9]. For compounds intended to act on a specific pathway, immunoblot or genetic knockdown of the implicated machinery remains the standard confirmation, as used in the published screens [6].
The LuminEV Research Kit runs a multiplex surface panel on conditioned media in a 96-well format, which makes it practical to read several markers per condition across a plate rather than choosing one marker and hoping it is the right one.
Where EV secretion pharmacology goes next
The compound lists in current reviews are long, but their selectivity is mostly uncharacterized at the subpopulation level [7,8]. Much of that library was assembled with total-output readouts, which means a second pass with subpopulation resolution would likely reclassify some compounds and rescue others that were scored inactive.
Three things would move the field forward. Reporting which vesicle population a compound affects, rather than only whether release went up or down, would make results comparable between labs. Standardizing culture and collection conditions would address the reproducibility problem that the published disagreements expose [3,4]. And linking in vitro profiles to what happens in an animal model would tell programmes whether a pathway-selective effect survives in vivo, which is where a therapeutic hypothesis is ultimately tested [5]. All three start from the same place: measuring which vesicles changed, not just how many.
References
- Trajkovic K, Hsu C, Chiantia S, et al. Ceramide triggers budding of exosome vesicles into multivesicular endosomes. Science. 2008;319(5867):1244-1247. https://doi.org/10.1126/science.1153124
- Mathieu M, Névo N, Jouve M, et al. Specificities of exosome versus small ectosome secretion revealed by live intracellular tracking of CD63 and CD9. Nat Commun. 2021;12(1):4389. https://doi.org/10.1038/s41467-021-24384-2
- Fonseka P, Chitti SV, Sanwlani R, Mathivanan S. Sulfisoxazole does not inhibit the secretion of small extracellular vesicles. Nat Commun. 2021;12(1):977. https://doi.org/10.1038/s41467-021-21074-x
- Lee CH, Bae JH, Kim JI, Park JM, Choi EJ, Baek MC. Reply to ‘Sulfisoxazole does not inhibit the secretion of small extracellular vesicles’. Nat Commun. 2021;12(1):978. https://doi.org/10.1038/s41467-021-21075-w
- Asai H, Ikezu S, Tsunoda S, et al. Depletion of microglia and inhibition of exosome synthesis halt tau propagation. Nat Neurosci. 2015;18(11):1584-1593. https://doi.org/10.1038/nn.4132
- Datta A, Kim H, McGee L, et al. High-throughput screening identified selective inhibitors of exosome biogenesis and secretion: a drug repurposing strategy for advanced cancer. Sci Rep. 2018;8(1):8161. https://doi.org/10.1038/s41598-018-26411-7
- Catalano M, O’Driscoll L. Inhibiting extracellular vesicles formation and release: a review of EV inhibitors. J Extracell Vesicles. 2020;9(1):1703244. https://doi.org/10.1080/20013078.2019.1703244
- Vecchione S, Talamillo A, Falcón-Pérez JM. A compendium of extracellular vesicle biogenesis inhibitors: from bench to bedside. Interdiscip Med. 2026;4(4):e70144. https://doi.org/10.1002/inmd.70144
- Welsh JA, Goberdhan DCI, O’Driscoll L, et al. Minimal information for studies of extracellular vesicles (MISEV2023): from basic to advanced approaches. J Extracell Vesicles. 2024;13(2):e12404. https://doi.org/10.1002/jev2.12404
- Tordoff E, Allen J, Elgart K, et al. A novel multiplexed immunoassay for surface-exposed proteins in plasma extracellular vesicles. J Extracell Vesicles. 2024;13(11):e70007. https://doi.org/10.1002/jev2.70007