


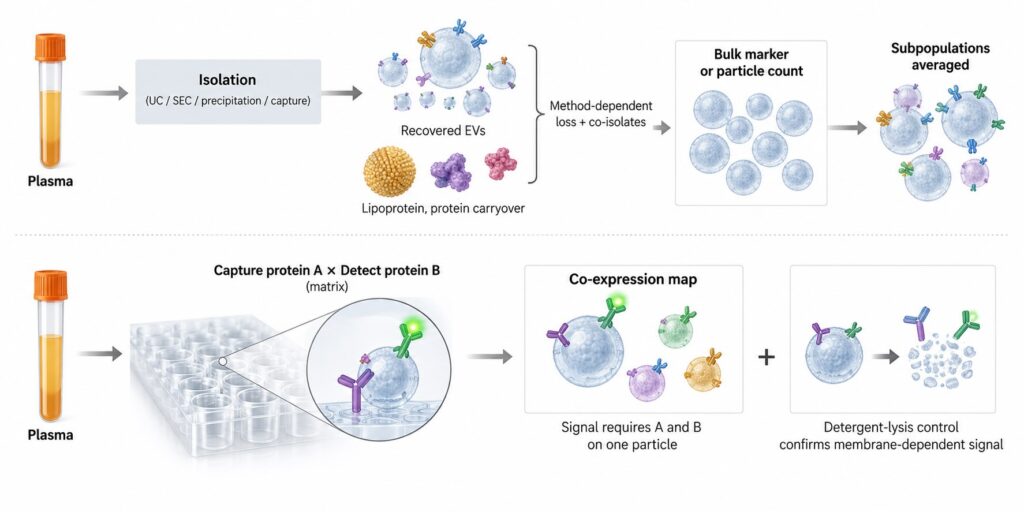
EV subpopulation profiling in plasma has a built-in confound: the isolation step decides which vesicles reach the assay. Ultracentrifugation, size-exclusion chromatography, precipitation and immunoaffinity capture each recover a different slice of the circulating extracellular vesicle (EV) population, along with different amounts of co-isolated lipoprotein and protein. When two studies report different subpopulation profiles, separating biology from method is often impossible. Profiling surface protein co-expression directly in plasma takes that variable out of the comparison.
Key Takeaways
- Plasma EV isolation methods differ in the size, proteome and tetraspanin profile of what they recover, so the method shapes the subpopulation you report [1].
- Particle counts are a poor denominator in plasma: isolation kits run on vesicle-depleted plasma return particle counts comparable to normal plasma [2].
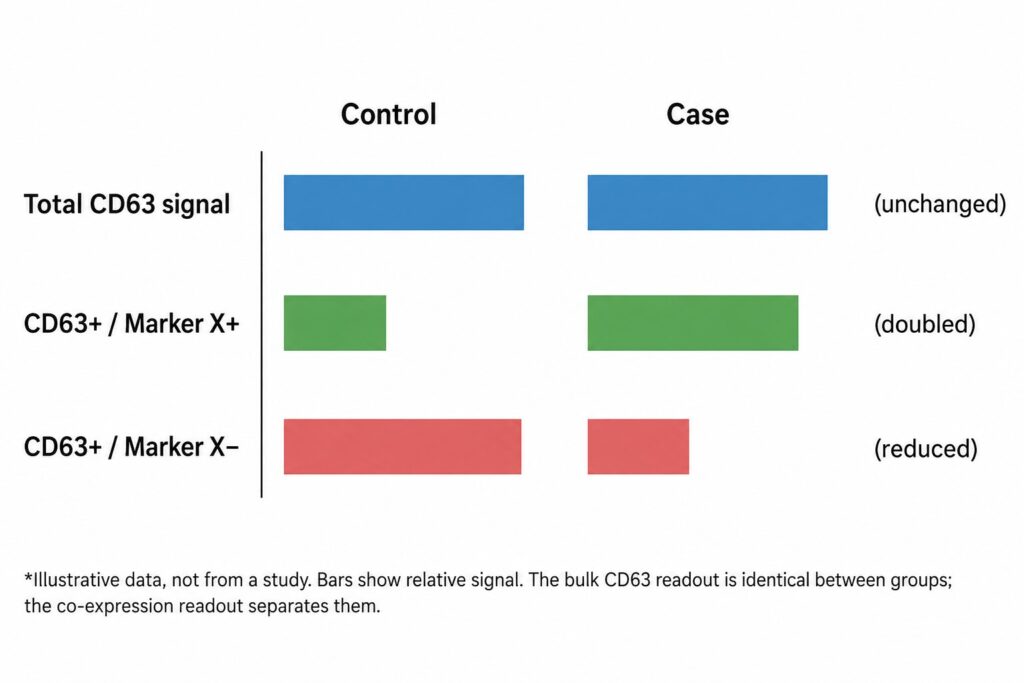
- Bulk markers average across subpopulations. A shift in which vesicles carry a marker can leave the total unchanged.
- Capture-and-detect immunoassays read protein co-expression on the same particle, in unprocessed plasma, with every subpopulation measured from one aliquot.
- Isolation-free is not bias-free. Antibody choice, detergent controls and MISEV2023 reporting still decide whether the data hold up.
What Is EV Subpopulation Profiling?
EV subpopulation profiling measures which surface proteins occur together on the same extracellular vesicles, rather than total vesicle number or a single marker. Vesicles of different cellular origin and biogenesis carry different protein combinations, so co-expression patterns separate subpopulations that bulk measurements average together.
The case for profiling subpopulations rests on how heterogeneous EVs turned out to be. Kowal and colleagues separated vesicles released by a single cell type by size, density and tetraspanin immuno-isolation, then compared their proteomes. Several proteins long used as generic exosome markers, including MHC molecules, flotillin and HSP70, were present across all the EV types they recovered. Only a smaller set of proteins distinguished small EVs of endosomal origin (exosomes, the vesicles released when multivesicular endosomes fuse with the plasma membrane) from other small EVs [3]. Jeppesen and colleagues then combined high-resolution density gradients with direct immunoaffinity capture. They found that several proteins long attributed to exosomes were absent from them, and identified annexin A1 as a marker of microvesicles shed directly from the plasma membrane [4].
Two conclusions follow. First, a single marker rarely defines a subpopulation; combinations do. Second, the subpopulations differ in origin and likely in function, which is why a recent Nature Nanotechnology review argues that EV heterogeneity should be treated as a source of diagnostic and therapeutic information rather than as noise to average away [5].
Why this matters more in plasma than in culture
Conditioned medium from one cell line contains vesicles from one source. Plasma contains vesicles from platelets, red cells, leukocytes, endothelium and, at much lower abundance, from solid tissues. The disease-relevant signal frequently sits in a minority subpopulation. A method that loses part of that minority, or dilutes it with unrelated particles, can erase the effect before any assay is run.
Every Isolation Method Keeps Some Vesicles and Loses Others
Veerman and colleagues ran one of the most direct comparisons available. They isolated EVs from conditioned medium and from 250 µL or 3 mL of human plasma using methods built on five different principles: polymer precipitation, membrane affinity, size-exclusion chromatography, iodixanol density gradient and phosphatidylserine affinity. The preparations differed in morphology, particle size and proteomic profile. The relative signal of CD9, CD63 and CD81 changed with the method, and proteins from different cellular compartments were enriched to different degrees, indicating that each method favors vesicles of particular subcellular origin. The authors concluded that no method suits all studies [1].
Contaminants follow the same pattern. Brennan and colleagues compared common isolation techniques, alone and in combination, on 200 µL of human serum, a volume chosen to mirror biobanked samples. The choice of method significantly changed EV yield and the amount of co-isolated lipoprotein, tracked through APOB and APOE [6]. That carryover matters because EVs are a minority particle in blood. Johnsen and colleagues estimated plasma EV concentration at roughly 1010 vesicles per mL, far below the concentration of lipoproteins, which co-isolate with EVs and carry biomarker molecules of their own [7].
Capture-based enrichment selects by design
Immunoaffinity enrichment introduces a different kind of bias: it recovers only vesicles that carry the capture antigen. Mizenko and colleagues mapped tetraspanin expression on single EVs and found that CD9, CD63 and CD81 are not evenly distributed across vesicles. Within a given source, the tetraspanin profile held steady across the isolation methods they tested. Capturing vesicles by tetraspanin, however, skewed the apparent co-expression profile and changed assay sensitivity for tumor-associated surface markers [8]. Pulling down “all EVs” with a tetraspanin cocktail is itself a subpopulation choice.
None of this makes isolation wrong. It makes isolation a variable. A 2025 commentary on the state of the field lists method-dependent differences in EV content and function among the main obstacles to reproducible EV research [9], and MISEV2023 asks researchers to report separation methods in enough detail for others to judge what was recovered [10].
| Approach | Separation principle | Effect on the recovered population |
|---|---|---|
| Differential ultracentrifugation | Sedimentation rate | Recovery depends on g-force, time and rotor; protein aggregates and some lipoproteins co-pellet |
| Size-exclusion chromatography | Hydrodynamic size | Removes most soluble protein; lipoproteins of similar size co-elute |
| Polymer precipitation | Reduced solubility | High particle yield with substantial non-vesicular co-precipitate |
| Density gradient | Buoyant density | Good separation from soluble protein; low yield; density overlaps with some lipoproteins |
| Immunoaffinity capture | Surface epitope | Recovers only vesicles carrying the capture antigen; skews co-expression toward it |
Qualitative summary of trade-offs reported in [1], [2], [6], [8] and [10]. Performance varies with protocol and sample.
Why Particle Counts and Bulk Markers Hide Subpopulation Shifts
The two readouts most EV studies report, particle number and a bulk marker, are both blind to subpopulations, and in plasma the first is not even reliably counting vesicles.
Particle counts in plasma are mostly not EVs
Tian and colleagues used a nano-flow cytometer that resolves single particles down to about 40 nm to benchmark five commercial isolation kits against ultracentrifugation on platelet-free plasma. When they ran the kits on plasma that had first been depleted of vesicles, they recovered particle counts comparable to those from normal plasma, which shows that much of what the kits returned was non-vesicular material [2]. Normalizing a marker to particle count in that situation divides by a number dominated by something else.
Bulk markers average away the signal
A western blot or single-analyte immunoassay for CD63 reports total CD63 across every vesicle that carries it. If disease expands one CD63-positive subpopulation while another contracts, the total can stay flat. The shift only becomes visible when CD63 is read together with a second protein on the same particle. Kowal’s observation that classical markers appear across all EV types makes the same point from the biology side: a marker present everywhere cannot tell subpopulations apart [3].
Figure 1. A subpopulation shift invisible to a bulk marker (illustrative).
Reading Co-Expression Directly in Plasma
Isolation-free profiling replaces the separation step with the assay’s own selectivity. In a capture-and-detect immunoassay, one antibody captures particles that carry protein A and a second antibody detects protein B. A signal requires A and B on the same particle. A soluble protein generates signal only if it carries both epitopes itself, so with A and B chosen as different membrane proteins the readout is inherently particle-associated. Each capture–detection pair reports one co-expression pattern, and a matrix of pairs maps the subpopulations present.
The approach is established. Wiklander and colleagues validated a multiplex bead-based flow cytometry assay that detects 37 EV surface markers simultaneously in one sample, semi-quantitatively. They showed it works on unprocessed cell culture supernatants, on EVs isolated by different methods, and on biological fluids, with reproducible detection of surface signatures [11].
Taking isolation out of the workflow changes four things for a plasma study:
- No method-dependent loss. Every subpopulation the panel targets is measured from the same starting material, so differences between samples are not differences in recovery.
- Lower sample volume. Isolation protocols in the comparisons above start at 200 µL to several mL. A direct assay uses a small aliquot per well, leaving banked plasma for other work.
- One run, one plate. All capture–detection pairs for a sample sit in the same run, which removes run-to-run drift from within-sample ratios.
- Throughput. Without a centrifugation or column step, a 96-well plate becomes the unit of work, which suits cohort-scale studies.
LuminEV is built on this logic: a multiplex immunoassay that profiles EV surface proteins directly in plasma in a 96-well format, with capture and detection markers configurable to the study question.
Figure 2. Isolation-first vs. isolation-free subpopulation profiling.
A Worked Study Design
Consider a case–control plasma study, for example in a neurodegenerative disease cohort, asking whether disease changes the balance between vesicles that carry a tissue-associated surface protein and those that do not. Table 2 lays out a design that keeps the comparison about biology rather than handling.
| Step | What to do | Why |
|---|---|---|
| Pre-analytics | One collection and plasma-preparation protocol for all participants; record it with the MIBlood-EV template; fix freeze–thaw cycles | Blood EV work involves hundreds of protocols and over forty pre-analytical variables [12] |
| Panel | Capture markers (tetraspanins plus source-associated proteins) crossed with detection markers; include tetraspanin-only pairs as reference | Co-expression, not single markers, defines subpopulations [3] |
| Controls | Detergent-lysed aliquot, buffer blank, irrelevant-capture control, pooled plasma QC on every plate | Loss of signal after lysis supports a membrane-bound origin [10] |
| Plate layout | Randomize cases and controls across plates; keep every pair for a sample on one plate | Prevents plate effects from aligning with group |
| Normalization | Express each subpopulation as a within-sample ratio (e.g., protein X+ CD9+ signal over total CD9+ signal), not per particle count | Plasma particle counts are dominated by non-vesicular material [2] |
| Orthogonal check | Analyze a subset after one separation method or with a single-vesicle technique and report agreement | Shows the pattern is not an artefact of the assay format [10] |
Two design choices carry most of the weight. The first is the within-sample ratio. Comparing the fraction of CD9-positive signal that also carries protein X is far less sensitive to how much plasma went into the well, or how many lipoproteins came with it, than an absolute signal is. The second is keeping every capture–detection pair for one sample on the same plate. In a LuminEV run the full matrix for a sample sits in one plate, so the ratio is calculated from measurements that share reagents, incubation and read.
The panel itself should start narrow. Four or five capture markers crossed with three detection markers already yields a dozen or more co-expression readouts per sample. Expanding the panel after a pilot shows which pairs carry signal is cheaper than starting wide and correcting for multiple comparisons across pairs that never move.
Limits, Controls, and MISEV2023 Reporting
Isolation-free does not mean bias-free. The antibody panel now does the selecting: subpopulations that carry none of the capture markers are invisible, and the choice of markers should be justified the same way an isolation method would be. Epitopes can be masked by proteins adsorbed onto the vesicle surface in plasma, and antibody performance varies between lots, which is why the pooled QC sample belongs on every plate.
Membrane dependence has to be shown rather than assumed. A detergent-lysed aliquot that loses signal supports a vesicle origin; signal that survives lysis points to a non-vesicular source, such as a protein complex that happens to carry both epitopes [10]. Capture-and-detect assays also report co-expression without size. When size matters, for example to separate small EVs from larger shed vesicles, the orthogonal single-particle check in Table 2 is not optional.
On reporting, MISEV2023 asks for enough detail on separation and characterization for others to judge what was measured [10]. For an isolation-free study, that means describing the readout as EV-associated surface proteins measured in unseparated plasma, documenting pre-analytics with MIBlood-EV [12], and reporting the detergent control alongside the main result. Precise reporting of this kind is what lets a subpopulation finding be compared with work done after isolation.
The field is shifting its question from how many vesicles a sample contains to which vesicles carry the signal [5]. Isolation will stay essential for proteomics, functional work and cargo analysis. For surface-defined subpopulations measured across hundreds of plasma samples, reading co-expression where the vesicles already are removes the variable that has made so many cross-study comparisons hard to interpret. The next step is shared panels and reference plasma pools, so that subpopulation maps from different cohorts and laboratories can be compared directly.
References
- Veerman RE, Teeuwen L, Czarnewski P, et al. Molecular evaluation of five different isolation methods for extracellular vesicles reveals different clinical applicability and subcellular origin. J Extracell Vesicles. 2021;10(9):e12128. https://doi.org/10.1002/jev2.12128
- Tian Y, Gong M, Hu Y, et al. Quality and efficiency assessment of six extracellular vesicle isolation methods by nano-flow cytometry. J Extracell Vesicles. 2020;9(1):1697028. https://doi.org/10.1080/20013078.2019.1697028
- Kowal J, Arras G, Colombo M, et al. Proteomic comparison defines novel markers to characterize heterogeneous populations of extracellular vesicle subtypes. Proc Natl Acad Sci U S A. 2016;113(8):E968–E977. https://doi.org/10.1073/pnas.1521230113
- Jeppesen DK, Fenix AM, Franklin JL, et al. Reassessment of exosome composition. Cell. 2019;177(2):428–445.e18. https://doi.org/10.1016/j.cell.2019.02.029
- Carney RP, Mizenko RR, Bozkurt BT, et al. Harnessing extracellular vesicle heterogeneity for diagnostic and therapeutic applications. Nat Nanotechnol. 2025;20(1):14–25. https://doi.org/10.1038/s41565-024-01774-3
- Brennan K, Martin K, FitzGerald SP, et al. A comparison of methods for the isolation and separation of extracellular vesicles from protein and lipid particles in human serum. Sci Rep. 2020;10:1039. https://doi.org/10.1038/s41598-020-57497-7
- Johnsen KB, Gudbergsson JM, Andresen TL, Simonsen JB. What is the blood concentration of extracellular vesicles? Implications for the use of extracellular vesicles as blood-borne biomarkers of cancer. Biochim Biophys Acta Rev Cancer. 2019;1871(1):109–116. https://doi.org/10.1016/j.bbcan.2018.11.006
- Mizenko RR, Brostoff T, Rojalin T, et al. Tetraspanins are unevenly distributed across single extracellular vesicles and bias sensitivity to multiplexed cancer biomarkers. J Nanobiotechnology. 2021;19:250. https://doi.org/10.1186/s12951-021-00987-1
- Salehi M, Torabi S, Seydi H, Shekari F, Vosough M. Extracellular vesicles and the Gartner hype cycle. J Extracell Biol. 2025;4(12):e70104. https://doi.org/10.1002/jex2.70104
- Welsh JA, Goberdhan DCI, O’Driscoll L, et al. Minimal information for studies of extracellular vesicles (MISEV2023): From basic to advanced approaches. J Extracell Vesicles. 2024;13(2):e12404. https://doi.org/10.1002/jev2.12404
- Wiklander OPB, Bostancioglu RB, Welsh JA, et al. Systematic methodological evaluation of a multiplex bead-based flow cytometry assay for detection of extracellular vesicle surface signatures. Front Immunol. 2018;9:1326. https://doi.org/10.3389/fimmu.2018.01326
- Lucien F, Gustafson D, Lenassi M, et al. MIBlood-EV: Minimal information to enhance the quality and reproducibility of blood extracellular vesicle research. J Extracell Vesicles. 2023;12(12):e12385. https://doi.org/10.1002/jev2.12385